

 Previous page
The longitudinal and transverse sound velocities, vp and vs, the associated quantities K and G (the bulk and shear modulus) and the derivatives (d ln vp,s/d ln rho)T and (d vp,s/d P)T are important parameters for understanding the Earth´s interior. In order to be able to determine the sound velocities and the cell parameters of a single crystal as a function of pressure (and temperature) we built a newly designed diamond anvil cell in Bayreuth. The cell was described in detail in the Annual Report 1996.
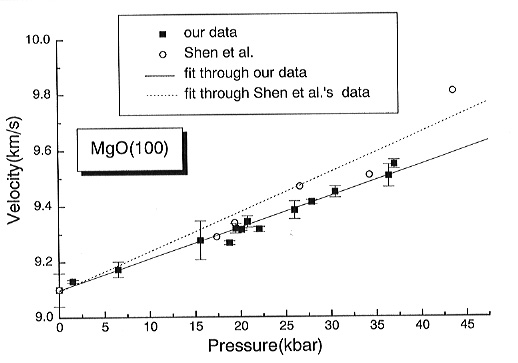
We have measured the travel time and the cell parameter of a MgO(100)
single crystal as a function of pressure at room temperature using the
new cell (Fig. 3.3-6 � 3.3-8). The thickness range of the samples was between
58 and 150 µm, and the pressure medium was a 4:1 methanol-ethanol
mixture or pure ethanol.
 |
|
Figure 3.3-6 depicts the progress we have made in improving the accuracy and precision of measuring the longitudinal sound velocity of samples at high pressure (Fig. 3.3-6 � 3.3-8). The solid lines are fits through the data. It can be clearly seen that the scatter of our new data is much less compared to those of Shen et al.
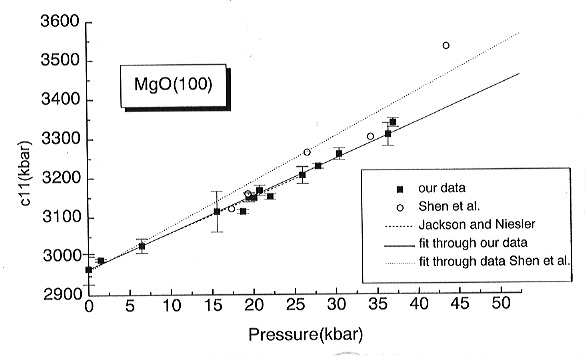
Figure 3.3-7 shows the elastic modulus c11 calculated from vp as a function of pressure. Again, the solid squares are our new data and the open circles are the data of Shen et al. (see Annual Report 1995). The dashed line represents the data by Jackson and Niesler, who measured the elastic moduli up to 30 kbar. There is an excellent agreement between our and Jackson and Niesler´s data. The displacement of the Shen et al. data to higher values probably reflects their use of KBr, which is a non-hydrostatic pressure medium.
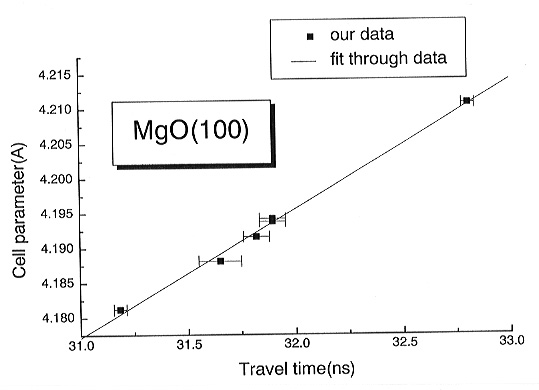
In Fig. 3.3-8 the cell parameter as determined by X-ray diffraction
is plotted vs. travel time measured at the same pressures. The errors of
the cell parameters are smaller than the symbols. Because no pressure measurement
is involved in this plot it is a true representation of the measurement
precision. It demonstrates the feasibility of performing simultaneous X-ray
and ultrasonic measurements in-situ at high pressures and opens
up the possibility of developing a primary pressure scale independent of
previous scales or secondary standards.
 |
|
 |
|

Tel: +49-(0) 921 55 3700 / 3766, Fax: +49-(0) 921 55 3769, E-mail: bayerisches.geoinstitut(at)uni-bayreuth.de