
The speciation of water in silicate melts has received considerable attention by geochemists over the last decades. Water can enter silicate melts either as molecular H2O or as hydroxyl groups. Both species are interrelated by a chemical equilibrium of the type
where "O" stands for some oxygen belonging to the silicate network. A consequence of this reaction is that the displacement of this equilibrium to the right hand side would cause a depolymerization of the silicate melt which would fundamentally affect viscosity, diffusivities and thermodynamic properties. Therefore, it is of fundamental importance for igneous petrologists to know the temperature dependence of the equilibrium constant
Molecular water and OH can easily be distinguished by the frequencies of combination bands in the near infrared spectrum of quenched glasses. OH appears in the spectrum as a band at 4500 cm-1 due to a combination of O-H and (Si,Al)-OH stretching vibrations. Molecular water gives rise to the combination band at 5200 cm-1 resulting from a combination of the stretching and bending modes. Therefore, attempts have been made already more than 20 years ago to determine the equilibrium constant of the water speciation reaction by studying the near infrared spectra of quenched glasses. Originally, it was assumed that these glasses represent the structural state of the melt at the temperature from which the sample was quenched. Later, Dingwell and Webb showed this hypothesis to be untenable because of the extremely fast relaxation in silicate melts above the glass transformation temperature, which is orders of magnitude faster than any achievable quench rate. A better approximation of the temperature dependence of water speciation can be obtained if one assumes that the speciation is effectively "frozen in" at the glass transformation temperature. However, even this model is an oversimplification, since different structural units in a silicate melt may have different relaxation rates, implying that water speciation may "freeze in" significantly below the bulk glass transformation temperature.
From the foregoing discussion, it is obvious that direct measurements
of water speciation at high temperature and pressure are necessary. We
have carried out such measurements by adapting an externally-heated diamond
anvil cell to an infrared microscope coupled with a Bruker IFS 120 FTIR
spectrometer. The microscope allows focusing of the modulated infrared
radiation from the interferometer on a very small spot of the sample. Due
to this focusing, the amount of thermal radiation from the hot sample reaching
the detector is negligible even at 1000 °C. However, in order to be
able to use an infrared microscope, the design of the externally-heated
diamond cell had to be modified to allow optical access with a solid angle
of 60 ° from both sides to obtain a sufficiently large infrared signal.
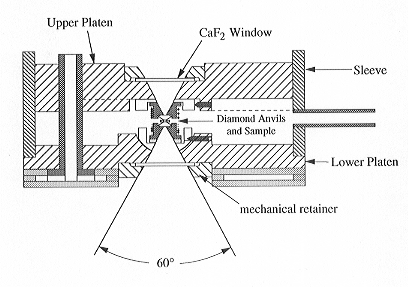
The design of our cell is shown in Fig. 3.6-3. Heating is achieved in this
cell by a number of electrical coils surrounding the diamond anvils and
the supporting tungsten carbide seats. Temperature can therefore be accurately
determined by a thermocouple touching the diamond anvils. Pressure in the
cell can be determined by using the equation of state of water (which is
the pressure medium) based on the observation that this cell behaves as
an isochoric system after a first heating cycle. At room temperature, the
water in the cell is in the two phase field, i.e. a liquid and a gas phase
are coexisting. Upon heating, the fluid phase homogenizes at some temperature,
which yields the bulk density of the fluid. Once this bulk density is known,
pressure can be calculated at any temperature.
 |
Fig. 3.6-3: Externally heated diamond anvil cell used for high-temperature FTIR studies. Height of the cell is about 4 cm. During operation, the cell is purged with an argon-hydrogen mixture to prevent oxidation of the diamonds. |
In order to measure water speciation in a silicate melt, we inserted a chip of a hydrous silicate glass into the cell. In this situation, accurate determination of pressure and temperature is not a problem, but how can one measure the IR spectrum of the hydrous melt without interference from the water used as pressure medium? This problem turned out to have a very simple solution. When the cell containing the sample heated for the first time, the glass chip starts to flow at high T and forms a round droplet. At the same time, the Re gasket collapses slightly, causing the melt drop to make contact with both anvil faces. This geometry allows FTIR measurements to be made through the hydrous melt under perfectly hydrostatic conditions without spectroscopic interference from the fluid.
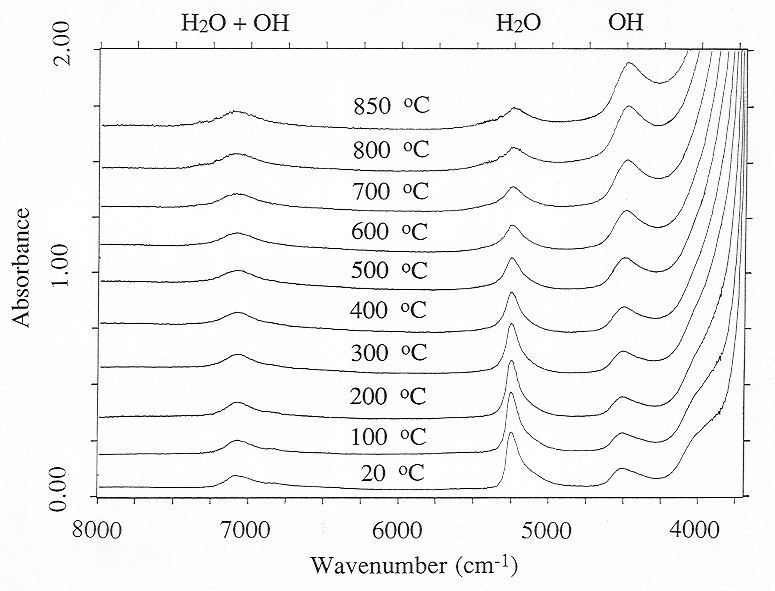
Figure 3.6-4 shows near infrared spectra of a peraluminous sodium aluminosilicate melt containing 8.1 wt% of total water up to 850 °C. These measurements were carried out with a density of the pressure medium close to 0.4 g/cm3 which yields a pressure of about 2.5 kbars at 850 °C. Experiments at pressures up to 7 kbars showed that pressure has little effect on water speciation in the melt. However, Fig. 3.6-4 reveals major changes in water speciation with temperature. With increasing T, the intensity of the band of molecular H2O at 5200 cm-1 decreases, while the OH band at 4500 cm-1 increases. On the other hand, the band at 7000 cm-1, which is proportional to total water (OH + H2O) shows little change in intensity.
The spectroscopic data in Fig. 3.6-4 suggest that with increasing T, the water speciation equilibrium is displaced in a way that H2O molecules are converted into OH groups, implying depolymerization of the silicate melt. However, the interpretation of the data is not quite that straightforward. Infrared spectroscopy measures absorbancy, which equals the product of extinction coefficient ε, species concentration c and sample thickness d:
Even if the thickness of the sample is constant, any change in absorbancy
could either be due to a change in extinction coefficient or to a concentration
change. Therefore, for a quantitative interpretation of the spectra, the
temperature dependence of the extinction coefficients has to be known.
In order to test whether there is a significant change of ε
of the combination bands with temperature, we measured the near IR spectrum
of pure water to 900 °C. The data showed the integral extinction coefficients
of the 7000 and 5200 cm-1 bands to be virtually constant. Therefore,
the data in Fig. 3.6-4 can be evaluated using the well-known room temperature
extinction coefficients. If one uses this approximation, indeed
 |
Fig. 3.6-4: High-temperature FTIR spectra of a hydrous, peraluminous sodium alumosilicate melt to 850 °C. Sample thickness is 195 mm. |
the amounts of OH and H2O in the sample always very closely add up to the total water content at all temperatures.
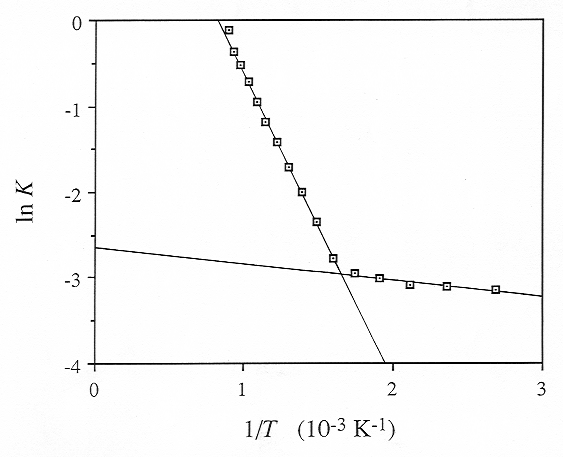
With the data presented in Fig. 3.6-4, it is now easy to calculate the equilibrium constant for the water speciation reaction. In Fig. 3.6-5, the logarithm of this equilibrium constant is plotted as a function of 1/T. Apparently, water speciation in the melt and glass phase can be described by two straight lines:
The intersection of these two straight lines defines a glass transformation
temperature based on water speciation of 335 °C. Note, however that
slight temperature dependent speciation changes already occur in the glass
phase.
 |
Fig. 3.6-5: Temperature dependence of the equilibrium constant K of the reaction O + H2O = 2 OH. The steep line applies to the melt phase, the shallow line is valid for the glass. The intersection defines the glass transformation temperature of 335 °C. |

Tel: +49-(0) 921 55 3700 / 3766, Fax: +49-(0) 921 55 3769, E-mail: bayerisches.geoinstitut(at)uni-bayreuth.de
 Previous page